Making the Most of Meter Data

By Gary Scheiner MS, CDE
Back in the 1960s, The Beach Boys released a hit song about the “plight” of American teens, called “Wouldn’t It Be Nice.” Those of us who live with diabetes have our own forms of plight. One involves the direction (or lack thereof) that we receive from our healthcare providers. Wouldn’t it be nice if they had the time and equipment to properly download all of our monitoring devices? And wouldn’t it be nice if they had the expertise to interpret the data in a way the led to practical solutions to our day-to-day blood sugar challenges?
We could go on and on, just wishing, and hoping, and thinking, and praying (lyrics from Dusty Springfield, also in the 1960s), but the fact is that healthcare providers who possess this kind of time, equipment and insight are becoming increasingly rare. It’s time to take the bull by the horns.
All modern blood glucose meters are downloadable to a PC running in a Windows environment, and most download to Mac systems as well. The meters attach a time and date stamp to each blood glucose value so that graphs, charts, and statistics can be generated. Of course, it helps if the meter’s clock and calendar are set properly, so check these before doing a download.
A few select meters allow us to enter management details such as carbohydrate intake, insulin/medication doses, and exercise. Others have event markers such as pre/post meal, illnesses, or dining out. This type of information is essential for getting to the root cause of out-of-range glucose levels. However, very few people who own advanced meters make full and consistent use of these features, so let’s focus on downloading blood glucose data only.
Setting Up Your System
Meter downloading software and cables are available free of charge in most cases. Just visit the company website or call the company directly using the toll-free number on the back of the meter.
Below is a summary of the equipment to ask for:
|
Meter Manufacturer |
Meter Type(s) |
Software / Website |
|
Abbott |
FreeStyle, Precision |
CoPilot Health Management System |
|
Abbott |
Insulinx |
FreeStyle Auto-Assist (plug and play software that is built into the meter; no installation necessary) |
|
AgaMatrix |
WaveSense |
Zero Click |
|
Bayer |
Contour, Contour Next |
Glucofacts Deluxe |
|
Bayer |
Contour USB |
Plug and play software built into the meter; no installation necessary |
|
LifeScan |
One Touch, Verio |
One Touch Diabetes Management Software |
|
Nova BioMedical |
NovaMax |
Nova Diabetes Software http://www.novamaxlink.com/nova-max-link/
|
|
Roche |
Accu-Chek |
Accu-Chek 360o Diabetes Management System https://www.accu-chek.com/us/data-management/360-software.html |
|
Sanofi Aventis |
iBGStar |
iBGStar app for iPhone, iPad – downloadable from app store
|
The Lowdown from the Downloads
Each software package offers its own unique set of reports. Most allow you to customize important factors such as your target blood glucose range and typical meal/snack times. Of the multitude of reports that can be generated, a few are particularly helpful.
The Standard Day or Modal Day report provides a scatter plot of blood glucose values arranged by time of day. It provides a quick visual summary of the blood glucose control at various mealtimes. Are there frequent highs or lows at certain times of day? Are the readings consistent or widely scattered?
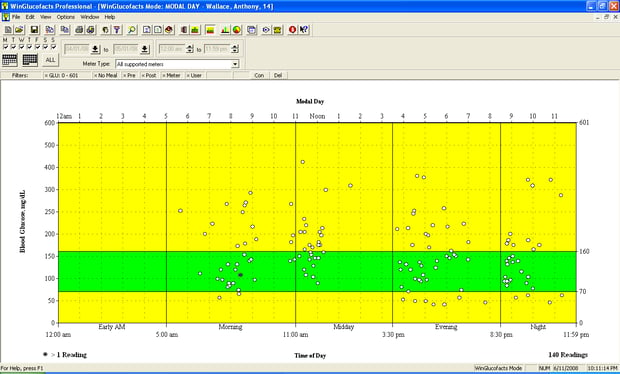
In the example above (a Modal Day report from Bayer’s WinGlucofacts software), the glucose levels at lunchtime are mostly above target. There are virtually no values below 100 mg/dl (5.5 mmol/l), so there is room to tighten up at lunchtime. The glucose values before dinner are frequently below target, so it may be worth addressing carb-counting accuracy at lunchtime, midday insulin doses, or afternoon physical activity.
Along with the Standard/Modal Day, a Statistical Summary can be quite useful. Statistical reports usually include glucose averages, standard deviations and percentage of values above, below and within the target range. It is best to evaluate this data according to time of day or day of the week.
Statistical summaries provide a good measure of what progress has been made since the last time changes were made to your program. In most cases, a low average and low standard deviation are desirable. A standard deviation that is more than 50% of the average indicates excessive variability in glucose levels; a value that is less than 33% of the average is highly desirable. Obviously, it is best to have a high percentage of readings within your target range. More than 10% in a low range, or more than 25% above your target range, usually indicates a need to make adjustments.
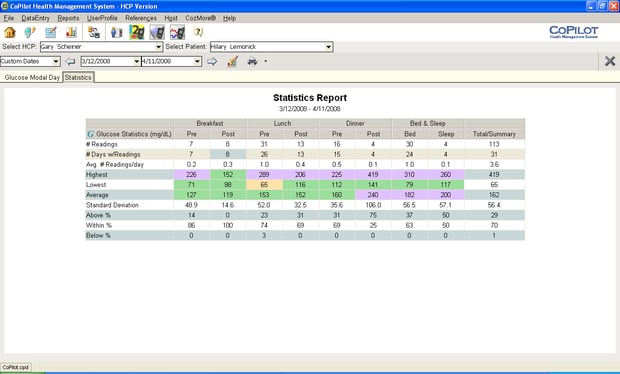
In the Statistics Report above (from Abbott’s CoPilot Software), high averages and a very large standard deviation are seen in the evening, perhaps related to carb counting inaccuracies at dinnertime.
Glucose Trend Graphs provide a longitudinal plot of blood glucose values over an extended period of time, such as a month or several months. By highlighting periodic peaks and valleys, these graphs can help determine whether therapy adjustments are needed for factors such as weekends versus weekdays, pre- versus post-menstrual cycles, or variations in seasonal activity. Trend graphs are also useful for illustrating improvements (or worsening) in glucose control changes over prolonged periods of time.
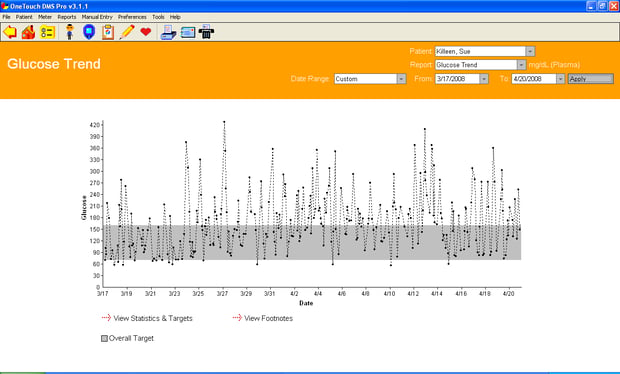
In the Glucose Trend Graph above (from Lifescan’s One Touch DMS software), glucose levels were elevated for several weeks from late March until mid-April. Perhaps this coincided with an illness or extended period of travel. Once the cause of control deterioration is determined, strategies can be implemented to prevent a recurrence.
Logbook reports provide a listing by time of day (or mealtime) of glucose values so that you can learn about cause-and-effect relationships. Do your high readings come down to normal by the next time you check? Are highs preceded by lows? Are your readings different on days when you are more physically active? Are glucose levels rising or falling overnight? If your meter includes entries for items such as insulin doses, grams of carbohydrate and physical activity, the logbook report can provide insight for fine-tuning insulin-to-carb ratios and exercise adjustments.
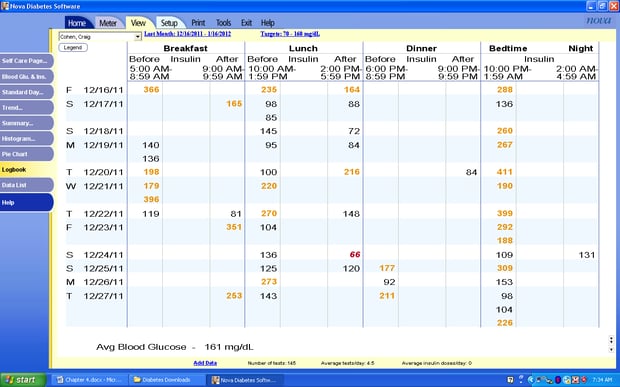
In the example above (from Nova Diabetes Software), elevated readings are common at bedtime. But also worth noting is that the elevated bedtime readings are often followed by elevated readings the following morning – indicating that the “correction doses” of insulin given at night may be too conservative.
We’ve all heard the philosophical question, “If a tree falls in the forest and nobody is around to hear it, does it make a sound?” From a diabetes standpoint, that question should be, “If blood glucose is measured but the data goes unused, does it do any good?” Pricking our fingers is the hard part. Looking at the numbers is easy. If it bothers you to see out-of-range readings, take a purely business approach. Evaluate your readings as an independent third party, pretending they belong to someone else. If that’s something you’re not comfortable with, give my office a call. We’d be happy to take a look for you.
Editor's note: A reader wrote after this article was published to take issue with Gary's statement about meter software and Mac compatibility: "All modern blood glucose meters are downloadable to a PC running in a Windows environment, and most download to Mac systems as well." We agree that downloading on a Mac is often possible in some way, but would stress that downloading on a PC is still easier in most cases.