Beyond the Numbers: Continuous Monitors Offer Much More than Blood Glucose Readings
.JPG) by gary scheiner MS, CDE
by gary scheiner MS, CDE
A couple of years ago, when real-time continuous glucose monitors were first introduced, my opinion was less than enthusiastic. I kept going back to the issue of accuracy. If blood glucose meters are within 15% of lab values, and CGMs are within about 15% of the meters, how useful could they possibly be? While we all consider blood glucose very accurate, a day does not go by without a call or e-mail from a concerned client doubting the usefulness of their CGM system.
In our experience at Integrated Diabetes Services, Freestyle Navigator from Abbott has delivered the best overall accuracy, but other groups have their own opinions. Published data show an average discrepancy of 14% between the numbers generated by Navigator and concurrent fingerstick readings. Our Integrated Diabetes Service team’s experience has been even better than that, with less than a 10% variance almost any time we’ve compared the Navigator against a meter. There are also plenty of times in our experience when the DexCom SEVEN and Medtronic’s Guardian REAL Time systems match well with meter-generated blood glucose values. And there are a number of techniques (proper sensor placement/insertion, calibration techniques, etc.) that can improve system accuracy.
Still, “consumer confidence” in the numbers themselves is sorely lacking. As I look at my CGM receiver right now and see that big “247 mg/dL” staring at me (who knew sloppy joe mix could have so many carbs?), but also see a 298 mg/dL on my trusty meter, one must ask: how much value do these systems really have?
Plenty.
For those of us looking for ways to improve our blood glucose control and make living with diabetes just a bit easier, CGMs do a lot more than just post numbers.
high/low alerts
Perhaps the most valuable aspect of CGM systems is their ability to alert the user when blood sugar levels may be approaching high or low levels. To me, they act sort of like “highway rumble strips” that keep us from veering off the road and into a ditch.
Although they may not detect every high and low, CGMs will provide an early warning for the vast majority – and much earlier than most of us would detect them on our own. Some systems even have predictive alerts: they let you know if your blood sugar is expected to cross your high or low threshold soon based on the current level and rate of change. The low alerts make it considerably safer to work, drive, exercise, and aim for tighter glycemic control. Likewise, the high alerts allow us to be more aggressive at managing after-meal blood sugar spikes, preventing ketoacidosis, and tightening the A1c since we can reduce the amount of time spent in a high range.

Medtronic CGM display with gradual downward trend.
short-term trends
Another valuable bit of information to go along with the immediate blood glucose value is the direction it is headed. If you checked your blood glucose at bedtime and found it to be 95 mg/dl, you would certainly react differently if you knew it was on the rise rather than if it was dropping. Similarly, a 188 mg/dL prior to exercise would mean more to you if you knew whether it was rising, falling or steady.
The Medtronic and Navigator CGM systems display up or down arrows to denote both the direction and magnitude of blood sugar changes over the past 20 minutes. The DexCom SEVEN system displays a 1-hour trend graph that reveals similar information. Use this information to your advantage! The ability to forecast where your blood sugar will be over the next couple of hours can help to keep you from straying too far out of your desired blood sugar range.
Another way to use the trend information is to adjust your meal and correction boluses based on where the blood sugar is headed. Rising gradually or sharply? Add 10% or 20% to your bolus. Dropping gradually or sharply? Deduct 10% or 20%. Remember, boluses are designed to get your blood sugar to normal in the next 3-4 hours. If there is a current upward or downward trend, the amount of the bolus will need to be adjusted accordingly.
long-term trends
All three of the major CGM models display longer-term glucose graphs. Although looking back at the past several hours of data will not help you fix a current problem, it can provide you with information for preventing a recurrence.
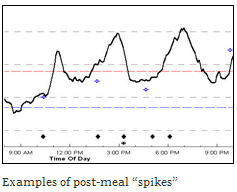
For example, checking the 2, 3 or 4-hour trend graph a couple of hours after meals can reveal the postprandial (after-meal) effect of various types of foods. Did your blood glucose level spike very high soon after the meal? If so, perhaps you need to give your bolus earlier. Did your blood glucose drop soon after the meal and then rise a few hours later? Perhaps you need to delay your bolus or extend the delivery.
 The 2-to-6-hour trend graphs can also reveal blood glucose patterns related to stress or exercise. Checking the graph during and after stressful events and physical activity will show when and how much your blood sugar rose or fell. The next time a similar situation arises, insulin and snack adjustments can be made based on the patterns seen on-screen.
The 2-to-6-hour trend graphs can also reveal blood glucose patterns related to stress or exercise. Checking the graph during and after stressful events and physical activity will show when and how much your blood sugar rose or fell. The next time a similar situation arises, insulin and snack adjustments can be made based on the patterns seen on-screen.
basal adjustments
The nine-hour graph on the DexCom system and 12-to-24 hour trend graphs on the Medtronic and Navigator can play a key role in the regulation of basal insulin, particularly overnight. By looking at the CGM’s trend graphs starting approximately 4 hours after the last bolus was given, you can evaluate the effectiveness of your basal insulin. If the blood sugar level is rising or falling after the food and mealtime insulin have worn off, the basal insulin probably needs adjustment.
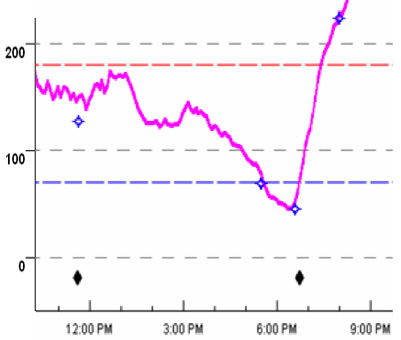
In the example below taken from an insulin pump user, with a meal eaten (and bolus given) at 11:30 a.m., the blood sugar level begins to take a downturn at around 4 p.m. This indicates that the basal insulin level is too high in the late afternoon.
In the next example, taken from a person using Lantus as their basal insulin, the blood sugar level is rising through the night from 2am until 8am. Potentially, this indicates the need for a higher dose of Lantus.
 In addition to helping fine-tune basal insulin doses, long-term trend graphs can be used to determine the action curve of your rapid-acting insulin. That is, how long it takes for your insulin to finish working (this is valuable in determining “insulin-on-board” or “active/unused insulin”). Action curves can vary from person to person, with times typically ranging from two to five hours. To determine your action curve, simply check to see how long it takes for your blood sugar to stop dropping after giving insulin for a meal or to correct a high blood sugar level. Once the line graph “flattens out”, the insulin has pretty much run its course.
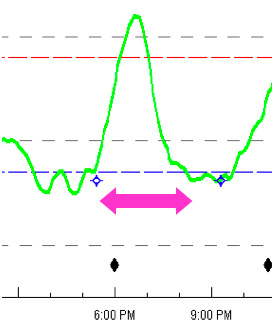
For instance, in the example below, the insulin action curve is approximately 3 hours. The bolus given for a meal at 5:30 seems to finish working by around 8:30.
It is best to verify that your basal insulin levels are set correctly before attempting to measure the insulin action curve. Basal rates that are too high will produce an artificially long action curve; basal rates that are too low will make it appear that the insulin runs out earlier than it actually does.
Long-term trend graphs are also useful for seeing the delayed effects of high-fat foods and intense/prolonged exercise, as well as blood sugar patterns during illness. The downloading programs that can be used with CGM systems (Medtronic’s Carelink website; DexCom DM2 software, and Abbott’s Copilot program) can be used to examine long-term trend graphs over multiple days. Checking the data during and after holidays, illnesses, menses, medication changes, and periods of very high physical activity can reveal patterns of higher- or lower-than-usual blood sugar levels.
more than just numbers
Whether you use your CGM data for dosing purposes or verifying the data with fingerstick readings, the simple act of looking at and using your monitor has its rewards. Research has shown that checking the monitor at least 12 times per day (hourly during waking hours) and wearing the system most of the time (rather than intermittently) tends to produce significant improvements in A1c and reductions in hypoglycemia.
With so much to learn and so many ways to use CGMs, it makes sense for more people to use them. As is the case with insulin pumps, success with a CGM usually hinges on having appropriate training and guidance. My practice (Integrated Diabetes Services) now offers a 1-time CGM data analysis service via phone and the Internet as well as a free in-office course every 3 months for those who want to learn more about analyzing/interpreting their own CGM data. For more information, call (877) 735-3648, visit www.integrateddiabetes.com, or write to me at [email protected]. Our web site also contains a detailed comparison of the various CGM systems for those who are considering which one to utilize:http://www.integrateddiabetes.com/CGMCompSep08.doc.