One Drop iPhone App Launches – Unique Logging App Has Future Potential

Twitter Summary: #OneDrop #diabetes app launches 4 iPhone + Apple Watch/ HealthKit. Future plans 2 launch Bluetooth meter, our pros + cons of this sleek new app
The new diabetes data-logging app One Drop is now available for free on iPhones and the Apple Watch (Android version coming soon). The logging app allows patients to input blood glucose, medications, meal, and exercise data, which integrate with Apple’s HealthKit platform. One Drop originally launched at San Francisco’s LAUNCH Festival 2015 in March, where it won “Best Design” Award (watch the six-minute pitch video). One Drop for iOS can downloaded here. While manual logging apps are old news, One Drop is approaching diabetes data from a new and innovative perspective – see details below on some of the unique insights, data displays, and community features we liked.
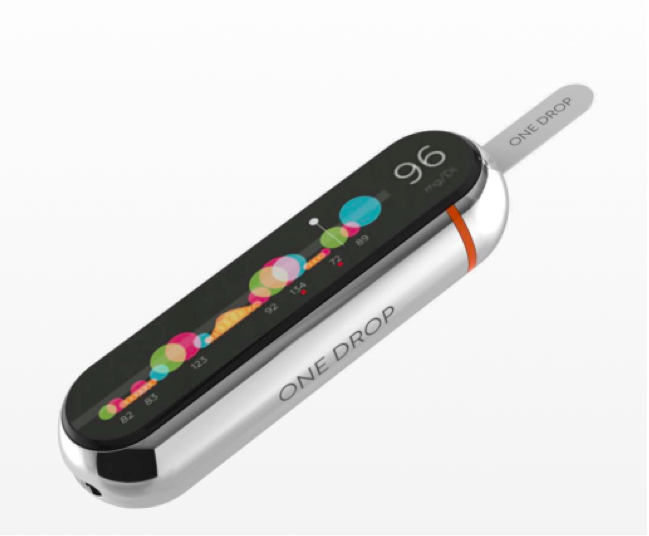 Particularly notable is the company’s future goal to develop a Bluetooth-connected meter to pair with the app – it’s not yet FDA approved, but the hope is for a launch in early 2016. Once on the market, users will pay a monthly subscription price to obtain strips, which will be sent via mail. The very ambitious goal is to make the program completely free if users have insurance, or less than the cost of a monthly co-pay for those paying cash. One Drop hopes to offer unlimited test strips.
Jeff Dachis (diagnosed with type 1 just 18 months ago) is behind the development and launch of One Drop; he brings impressive technology and digital marketing expertise to diabetes, which is readily apparent from the app’s sleek design, big focus on creating a positive and engaging user experience, and commitment to motivating and empowering its users. We’re always excited to see new players in diabetes technology, particularly those bringing a mix of personal connection and deep experience in another field.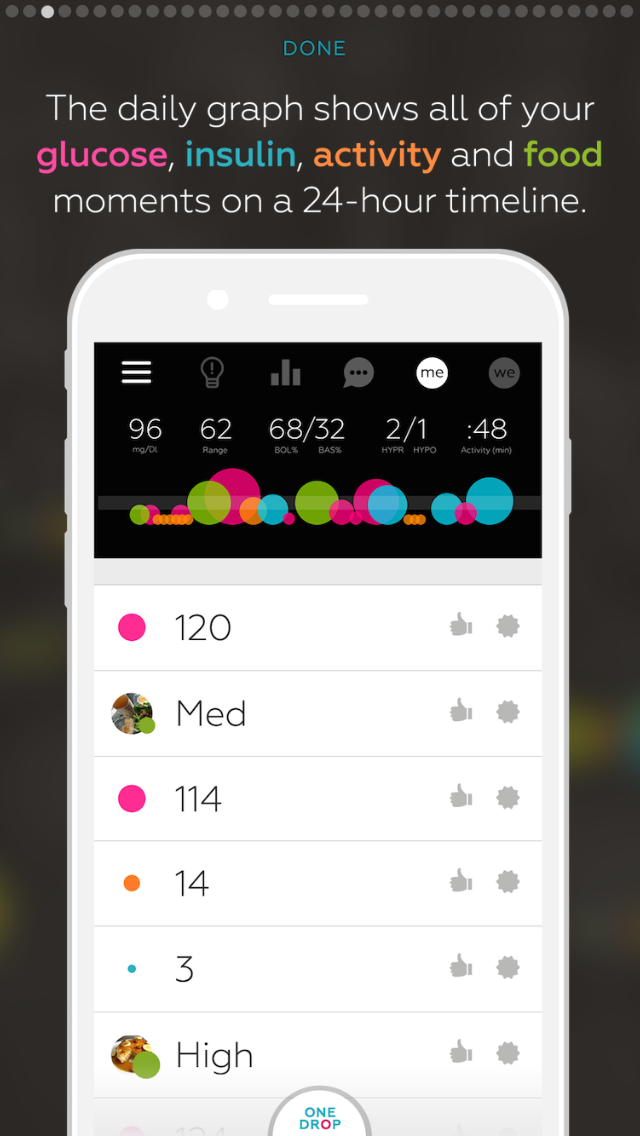
Below, we share some of the pros and cons of using the new logging app. Jeff told us that the team expects to release new versions every couple of weeks, so we have no doubt this is a work in progress and it will improve markedly with time. If you’ve used One Drop, let us know what you think!
One Drop App – The Pros:
-
Users can log values in four key areas, which offers a unified view of the key factors affecting diabetes: “Check” (blood glucose, represented in pink), meds (insulin, in blue), food (take a picture of a meal, in green), and move (activity, in orange). These all appear on the same chart, which can be daunting (see below), though also instructive. This combination of food, insulin, activity, and glucose information into a single app is part of what makes One Drop unique compared to many other logging apps already available.
-
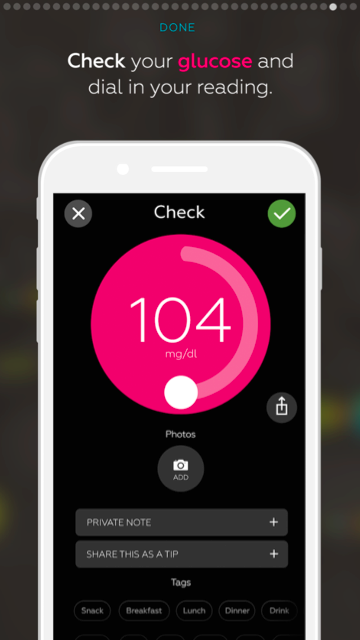
Though manual logging apps put a lot of burden on patients, One Drop has incorporated some novel solutions to make it easier. Most notably, glucose, insulin, and activity values are entered into the app by dragging a circular dial, which is much quicker than typing numbers in. For those who currently use Apple’s Health app, One Drop can pull the exercise data in automatically. In the future, One Drop hopes to pull CGM and insulin pump data from the Health app, eliminating the need for manual logging. We’re told this should be available in the next release in several weeks. And as mentioned above, the Bluetooth-connected meter will also talk to the app.
-
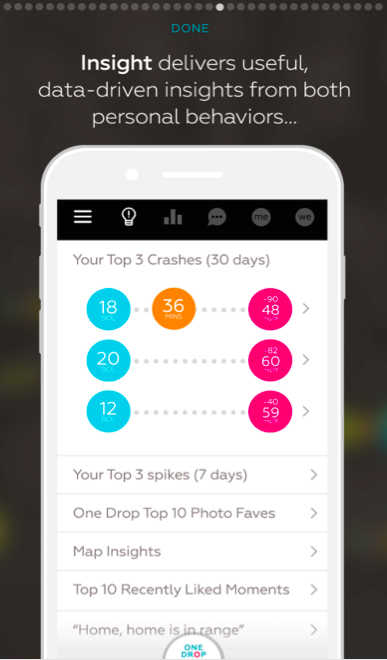
One Drop provides great “highest glucose moments” and “lowest glucose moments” screens, which provide the top five high/low glucose levels and pair them with the food/insulin data that followed those moments (e.g., a food entry that led to a spike in blood glucose or an insulin entry that led to a low glucose moment). We like the paired approach and think patients could get a lot of insight from this screen. The team has a lot of other insights screens planned, which should help patients better understand what is driving their out-of-range glucose values.
-
OneDrop does a great job of using motivating, encouraging language and notifications. There’s a non-judgmental, positive feel to the app – some example notifications from our early trial of the app:
-
You’ve hit 3 in-range glucose readings in a row! Obviously awesome, but you know that.
-
Nice food logging, looked pretty tasty. It’s always good to get in a glucose check to find out where you are at. Let’s do this!
-
You’ve logged 3x in a single day! Clearly, you are getting the hang of this.
-
-
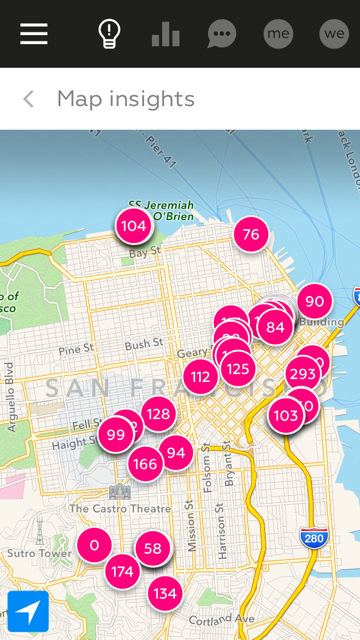 One Drop’s community feature allows users to congratulate each other, view each other’s glucose stories, and share tips. Each logged entry is posted to the community, allowing a global view of what everyone using the app is doing. This aspect is particularly neat if you’re in an urban area; the map feature shows you the nearby logged glucose values of others that used One Drop (see our screen shot of the One Drop map in San Francisco). The community feature brings a heightened feeling of “you’re not alone,” which some people may appreciate.
One Drop App – Opportunities for Improvement:
-
While the design is cool and modern-looking, One Drop does put the burden on patients to log glucose, exercise, meal, and insulin information – it’s only as useful as the amount of time a person is willing to put into using it. We salute the app for trying to make this as easy as possible, though we have found it tough to stay engaged.
-
 The One Drop app relies a lot on visual learning and interpretation; some users may find this easier to understand than other diabetes apps on the market, but in our experience it takes some getting used to. Each logged piece of information is depicted by a colored circle depending on the type of data (green circle = food, pink circle = blood glucose, etc.) – all the “drops” appear on the same graph, which helps link different events together (e.g., a specific glucose value followed by a meal followed by insulin followed by exercise).
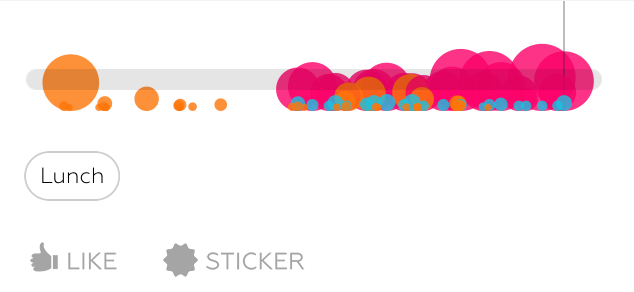 The visual depiction is highly unique, though we found it a bit overwhelming at first. When logging a lot of information, the circles begin to pile on top of each other (see screen shots), which can make it tough to pull out actionable takeaways from the data.
-AB/AJW