
Going Beyond A1c – One Outcome Can’t Do It All
By Adam Brown
By Adam Brown, Lynn Kennedy, Ava Runge, and Kelly Close
What does A1c miss and what can we do about it?
The diaTribe Foundation presented at FDA! Check out the slides here.
The Food and Drug Administration (FDA) hosted a landmark Public Workshop on August 29 – “Diabetes Outcome Measures Beyond Hemoglobin A1c (HbA1c)” – co-organized by The diaTribe Foundation, ADA, AACE, JDRF, and Scripps Translational Science Institute.
For the FDA and many payers, A1c is currently the “gold standard” used to assess diabetes therapy – it reflects average blood glucose levels over a two-to-three-month period, and in turn, the long-term risk of complications from high blood sugar (hyperglycemia). An A1c of less than 6.5% or 7% is the goal for most people with diabetes.
But A1c has limits: it cannot capture other critical outcomes that matter to patients on a daily basis. Low blood sugar (hypoglycemia) can be fatal, and yet, A1c tells us nothing about it. New therapies may dramatically improve quality of life, but those improvements won’t show up in an A1c value. Two people can have the exact same A1c value, but spend wildly different amounts of time at high and low blood glucose values.
The diaTribe Foundation believes the review of new diabetes therapies should expand to reflect both the long-term and short-term risks that patients face, the daily tradeoffs that patients make, and the key barriers to better outcomes. This means going beyond A1c! Given recent improvements in glucose sensing devices and understanding of people living with diabetes, A1c can now be supplemented by other important tools.
This article unpacks why going beyond A1c is important and shares other ways of measuring diabetes success. Click any of the points in the summary section immediately below for a more detailed dive into the latest science!
Why is there a need for additional outcomes measures beyond A1c?
-
One severe episode of low blood sugar can be fatal, but A1c does not capture hypoglycemia. Therapies that reduce hypoglycemia will dramatically help patients, even if they do not change A1c. In fact, reducing episodes of hypoglycemia could raise A1c levels but significantly reduce the risk of death, serious injury, or a trip to the ER. Fear of hypoglycemia also stands as the biggest barrier to tighter glycemic control.
-
A1c is not a one-size-fits all metric – depending on the person, an 8% A1c value could reflect an average blood glucose from 140 mg/dl all the way up to 220 mg/dl due to individual differences in how red blood cells and blood sugars bind.
-
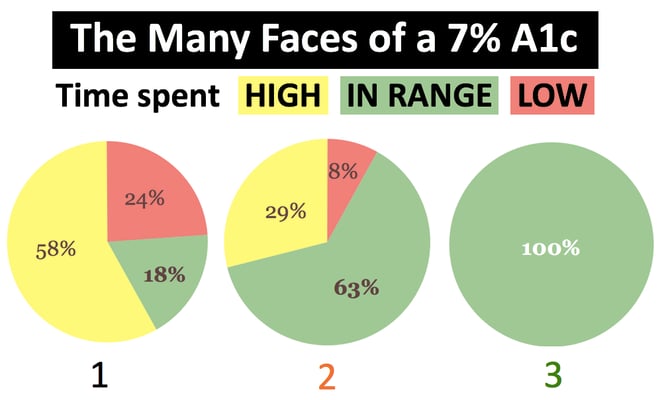
A1c is an average that does not capture many important variables, including time spent in different glucose ranges and glycemic variability. The same A1c of 7% could reflect 100% time-in-range or 18% time-in-range over a period of three months. We need a more nuanced understanding of blood glucose changes.
-
The accuracy of glucose sensors has improved dramatically in the past three years. Reliable sensors now exist that offer more comprehensive and actionable measurement of glucose than A1c or fingersticks.
-
Diabetes is an extremely burdensome, 24/7 condition that leads to many negative feelings (e.g., stress, guilt, failure, exhaustion, fear) and doubles the risk of depression. A1c does not capture how different therapies affect quality of life.
Are any outcomes measures beyond A1c already used to evaluate diabetes treatment efficacy? What are the alternatives?
-
The FDA Device Division (CDRH) already recognizes the validity of measurements like time-in-range and hypoglycemia as outcomes for automated insulin delivery.
-
The European Medicines Agency (the European equivalent of the FDA) includes CGM in its clinical investigation guidelines for developing diabetes drugs. These were released four years ago.
Dive Deeper!
Why is there a need for additional outcomes measures beyond A1c?
1. One severe episode of low blood sugar (hypoglycemia) can be fatal, but A1c does not capture hypoglycemia – it only measures average blood sugar over a two-to-three-month period. Therapies that reduce hypoglycemia could dramatically help patients – by significantly reducing the risk of death, serious injury, or trips to the ER – even if they keep A1c the same or slightly raise it. Fear of hypoglycemia also stands as the biggest barrier to tight glycemic control. Regulatory decisions could benefit from more accurate measures of the actual risks of hypoglycemia alongside diabetes drugs and technology – something currently not possible with A1c as the sole outcome measure.
-
Hypoglycemia is often cited as “the limiting factor in the glycemic management of diabetes,” yet A1c doesn’t provide information about it. Hypoglycemia is scary, life-threatening, and immediate, whereas A1c provides information on the probabilities of complications that are years away. Regulatory decisions made based on A1c and other diabetes outcomes measures could better account for this fundamental distinction between long- and short-term risks, giving at least as much weight to hypoglycemia as to A1c. The FDA’s 2008 guidance on diabetes drug development does not discuss hypoglycemia prominently enough relative to the daily impact it has on people with diabetes and public health – the subject is included in Appendix B on page 28 of 34.
-
In recent epidemiologic studies assessing causes of death in type 1 diabetes (EDIC, Swedish Diabetes Registry, and Scottish Diabetes Registry), hypoglycemia was reported to be responsible for 5%-10% of deaths. Moreover, a recent analysis of more than 500,000 people with type 2 diabetes illustrated unacceptable rates of hypoglycemia: 45% were found to have mild/moderate hypoglycemia, with 6% experiencing severe hypoglycemia – these rates are alarmingly high.
-
People with well-managed diabetes – achieving A1c levels below 7% – have even greater risks. In the landmark JDRF CGM study, people with diabetes whose A1c levels were less than 7% experienced more than 90 minutes per day in hypoglycemia (below 70 mg/dl). Another recent overnight study in type 1 was even more alarming: from a baseline A1c of 6.8%, patients spent 1 out of every 1o nights with a glucose level below 60 mg/dl for two hours or more.
-
Many people with diabetes would accept a 0.2% increase in A1c if they could experience even one less hour per day with blood sugar below 70 mg/dl. However, studies repeatedly show that people on insulin routinely spend over 90 minutes per day with low blood sugar (see above). We think it would be very useful if the FDA would seek patient input on acceptable benefit-risk tradeoffs of reducing A1c versus hypoglycemia.
-
In 2009, hypoglycemia hospitalizations alone cost the US over $4.7 billion (half a million dollars per hour), close to the FDA’s entire 2016 budget of $4.9 billion. This included 248,422 hypoglycemia hospitalizations in type 2 diabetes and 20,839 hospitalizations in type 1 diabetes at an average price tag of $17,654 each.
2. A1c is not a one-size-fits all metric – an 8% A1c value could reflect an average blood glucose between 140 mg/dl to 220 mg/dl due to individual differences in how red blood cells and blood sugars bind. Clinicians cannot effectively develop therapy strategies based on A1c alone. Regulatory decisions should be broadened accordingly..png)
-
People with diabetes demonstrate tremendous variation in glycemic control for a given A1c level, with an approximately 80 mg/dl range in average glucose for the same A1c level. The chart below, presented by T1D Exchange investigators at ADA, plots mean glucose as measured with CGM (x-axis) vs. A1c on the y-axis. Note the wide dispersion around the average line.
-
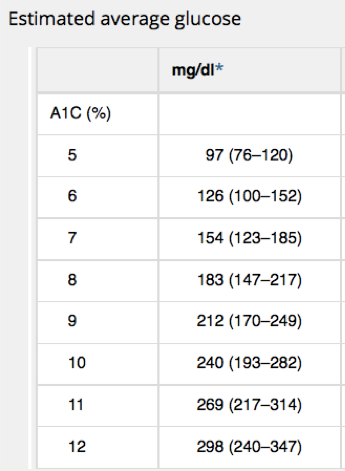
Another frequently cited study showed that an A1c of 7% could reflect an average blood glucose value anywhere from 123 mg/dl to 185 mg/dl; an A1c of 9% ranges from 170 to 249 mg/dl, and an A1c of 11% ranges from 217 vs. 314 mg/dl.
-
A1c is a valuable measure for how a population is doing with diabetes, but for individuals themselves, knowing what goes into a person’s A1c is really important. Dr. Irl Hirsch (University of Washington) reported at a recent conference that ~14-25% of patients in his large diabetes practice present with “glycation gaps” – A1c levels that do not reflect actual blood glucose. We often reference “quality of A1c” at diaTribe – a “high quality” A1c is a number within the guidelines (set at below 7% by ADA and below 6.5% for AACE for adults) and with limited hyperglycemia and hypoglycemia.
3. A1c is an average that does not capture many important variables, including time spent in different glucose ranges and glycemic variability. A single measure reflecting a two-to-three-month period is too crude to adequately characterize glycemic control that changes minute to minute, often unpredictably and dangerously (especially in insulin users).
-
A1c is a validated metric for assessing the risk of long-term complications, but it provides only a limited window as an average. A 7% A1c, equating to an average glucose over a period of months, does not say much about the daily risks for patients or the range of benefits a new therapy may have. People living with diabetes experience different energy levels, moods, and overall quality of life when they are “in-range” vs. “out-of-range.” Regulatory decisions could benefit from taking these subtleties into account, something not possible with A1c alone.
-
As Drs. Aaron Kowalski and Sanjoy Dutta described in 2013: “A mean speed of 55 mph over the past three months of commuting will never reflect times when a vehicle is racing at 100 mph and far in excess of the speed limit or is slowed to 10 mph in traffic congestion. Similarly, the clinician only receives the most basic of information from the HbA1c measurement and masks the occurrence and frequency of dangerous highs and lows.”
-
The images below illustrate the limitations of an average. The pictures show markedly different glycemic profiles with the same average blood glucose of about 154 mg/dl (an A1c of about 7%). One profile has high variability with dangerous highs and lows (black), one has moderate variability and fewer highs and lows (orange), and one has little variability with all time spent in-range (green).

-
Current regulatory standards – using A1c alone as a measure of diabetes outcomes – would treat therapies the same if they resulted in the different profiles above, even though far different benefit-risk profiles accompany each. New therapies would benefit from a “speedometer” measure.
4. The accuracy of glucose sensors has improved dramatically in the past three years. Accurate, reliable devices now offer more comprehensive and actionable measurement of glucose than A1c or fingersticks. CGM and similar technologies collect higher quality, more unbiased glucose data; capture nighttime lows; differentiate between fasting and post-meal glucose excursions; and inform early trial designs to speed innovation. The FDA’s review of new therapies will benefit greatly from adopting broader use of CGM or similar technologies in clinical trials.
-
CGM collects higher quality, more unbiased glucose data than the daily seven-point fingerstick profiles typically used in diabetes drug trials. CGM is 24/7 and captures up to 288 measurements per day; fingersticks are infrequent and rarely taken more than ten times per day. In addition to collecting more data, CGM also overcomes many fingerstick limitations, such as blood sample dilution, finger contamination, test strip damage, inadvertent oversampling of high or low blood sugar instances, etc.
-
Life-threatening severe hypoglycemia is most likely to occur at night, leaving a major gap in current data collection with fingersticks. CGM captures all nighttime lows, overcoming a key weakness of using fingersticks.
-
CGM can help investigators and companies better understand how a drug affects blood sugar at different times. This is key for understanding how a drug works and how it should be dosed. Additionally, CGM may help small companies obtain partnerships or secure funding, critical for continued innovation and development of new therapies.
-
Wearing CGM is less of a hassle for trial participants than frequent daily fingersticks. Many trials continue to require seven-point daily self-monitored blood glucose profiles – this asks a lot of trial participants who are not used to checking blood glucose so often.
5. Diabetes is an extremely burdensome, 24/7 condition that leads to many negative feelings (e.g., stress, guilt, failure, exhaustion, fear) and doubles the risk of depression. A1c does not provide any information on how different therapies affect quality of life. Two therapies that offer similar A1c reductions but have different effects on daily functioning and well-being should not be weighed equally. A therapy’s efficacy relates to how likely it is to be taken, which is often driven by factors – such as energy levels, sleep, mood, weight gain, etc. – other than just blood sugar values. FDA’s decisions on new drugs would be strengthened by including standardized quality of life considerations. We also hope “patient reported outcomes” can be added to product labels so that patients have a better idea about how drugs affect psychosocial elements of their disease. To better understand this arena, see our articles on stigma, the DAWN 2 study, and the diabetes emotional rollercoaster.
Are any outcomes measures beyond A1c already used to evaluate diabetes treatment efficacy? What are the alternatives?
-
Some healthcare professionals use direct blood glucose metrics – average glucose AND time in various blood glucose ranges (less than 70 mg/dl, 70-180 mg/dl, and above 180 mg/dl) – to select and adjust therapies for individuals. Approving new therapies in the same way could provide even more information to help healthcare professionals individualize diabetes treatment plans further and help make information more understandable for patients (if this information was on labels, we think people would be more likely to read it!).
-
The FDA Device Division (Center for Devices and Radiological Health) already recognizes CGM-based measurements of time-in-range and hypoglycemia as outcomes for automated insulin delivery devices. The original FDA artificial pancreas guidance, released in 2011, was very focused on A1c. After education by JDRF and many other patient advocates, the division came back in 2012 with an updated, final guidance that incorporated a variety of outcome metrics. Earlier this summer, the division hosted a very positive meeting about using CGM for insulin dosing. It would be terrific to see even more collaboration at FDA, where the Drug Division (Center for Drug Evaluation and Research) could collaborate with its colleagues in the Device Division to further understand the role of CGM metrics in trial design, regulatory reviews, and product innovation. We’re sure this is already happening in the background – we do feel that FDA has been consistently under-resourced in both divisions and would like to see them receive meaningfully more funding, commensurate with their much greater responsibilities.
-
The European Medicines Agency (the European equivalent of the FDA) includes CGM in its clinical investigation guidelines for developing diabetes drugs. These were released in 2012. The guidelines note the value of CGM for describing overnight blood glucose profiles and post-meal spikes in blood sugar. Ultimately, we are excited to begin a dialogue with the Drug Division (CDER) that may result in similar language included in the FDA’s drug development guidance to incorporate CGM metrics in regulation considerations. To do this, the FDA’s 2008 drug guidance would require some re-examination – we were excited to speak to FDA about the possibility of that happening!
To learn more about the FDA Public Workshop on Diabetes Outcome Measures Beyond Hemoglobin A1c, click here for a blog post by the diaTribe team. We were very excited to see so many patient opinions shared through a video, patient impressions, and a patient survey – be sure to let us know of any questions or comments you have!


